Report Group
About Report Groups
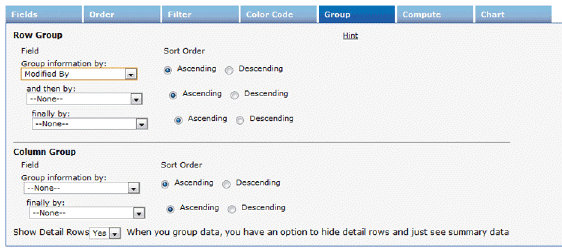
Select fields to summarize data by Row or Column (Row Group and Column Group).
Use them to created tabular reports and matrix (cross tab or pivot table) reports.
Tabular Report
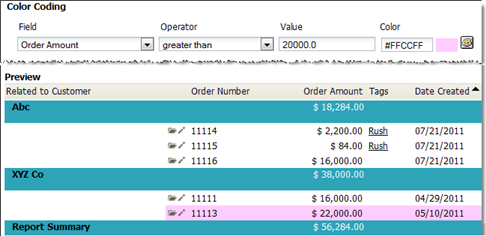
Tabular reports display data in rows and columns, as a table, with optional Color Coding to highlight significant rows.
Matrix Report
Matrix reports are used to organize and summarize your data, and are exceptionally well-suited for chart and dashboard views.
The Matrix Report has a familiar format that you may know as a cross tabulation report (cross tab) or a pivot table. The resulting data is organized into a two dimensional grid which summarizes data (by total $, row count, or %).
The Matrix Report shows only summary information, based on the selected Row and Column Groups.
To create a Matrix Report, add one or more Row Groups and one or more Column Groups.


