Difference between revisions of "Tabular Report"
From AgileApps Support Wiki
imported>Evelyn m |
imported>Aeric |
||
| (2 intermediate revisions by the same user not shown) | |||
| Line 1: | Line 1: | ||
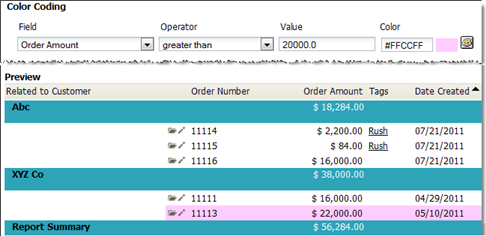
Tabular reports display data in rows and columns, as a table, with optional [[Color Code|Color Coding]] to highlight significant rows. | |||
::[[File:Report-tabular.png|frame|left|Table of Orders by Customer]]<br style="clear: both" /> | |||
Latest revision as of 20:48, 21 July 2011
Tabular reports display data in rows and columns, as a table, with optional Color Coding to highlight significant rows.
